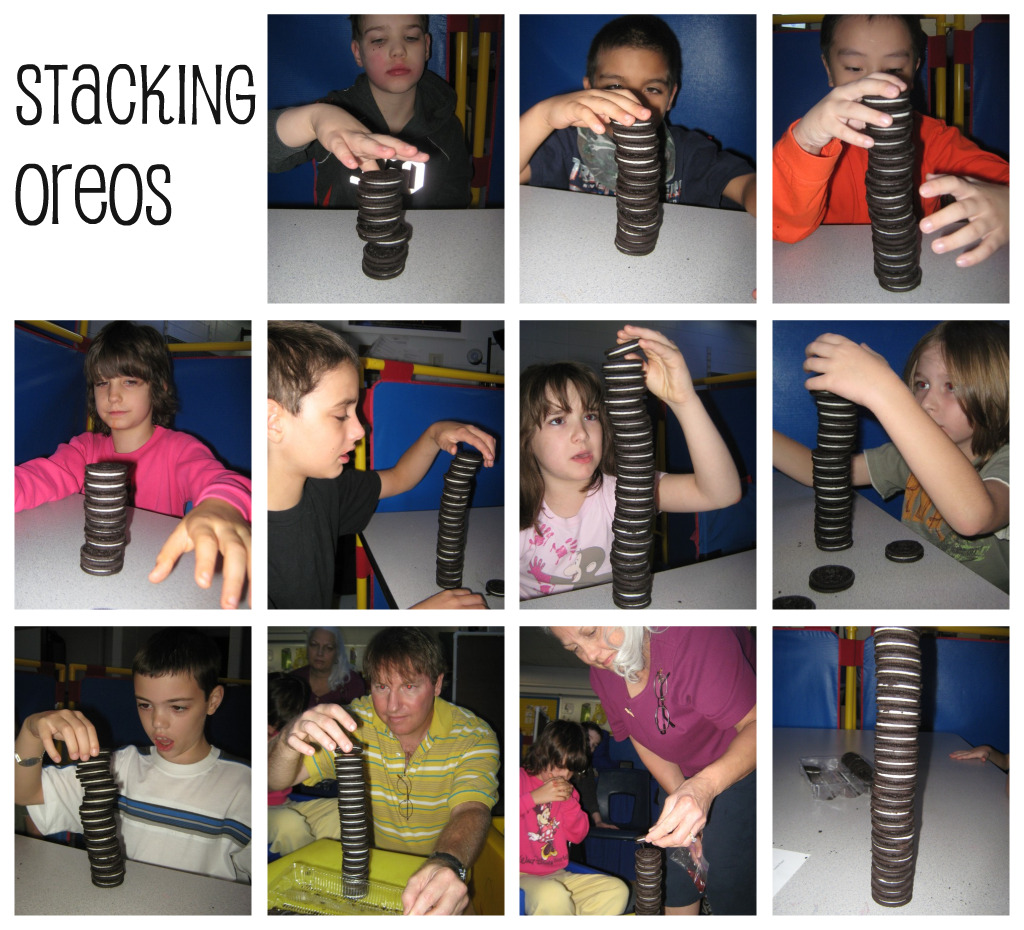
Today we stacked oreo cookies! First we counted how many each person could stack, then each student filled in a chart with the number of cookies they stacked. Then we took the chart and made a bar graph – one on the board and one on the computer. Then we looked at the graph to see who stacked the most, least, and who stacked the same amount as someone else. Finally we used a calculator to add up the numbers and divide by 11 to see what our class average was, and submitted it to the Oreo 2009 project website.


Nicole,
Great project. I did it when I was at KES and the kids loved it!