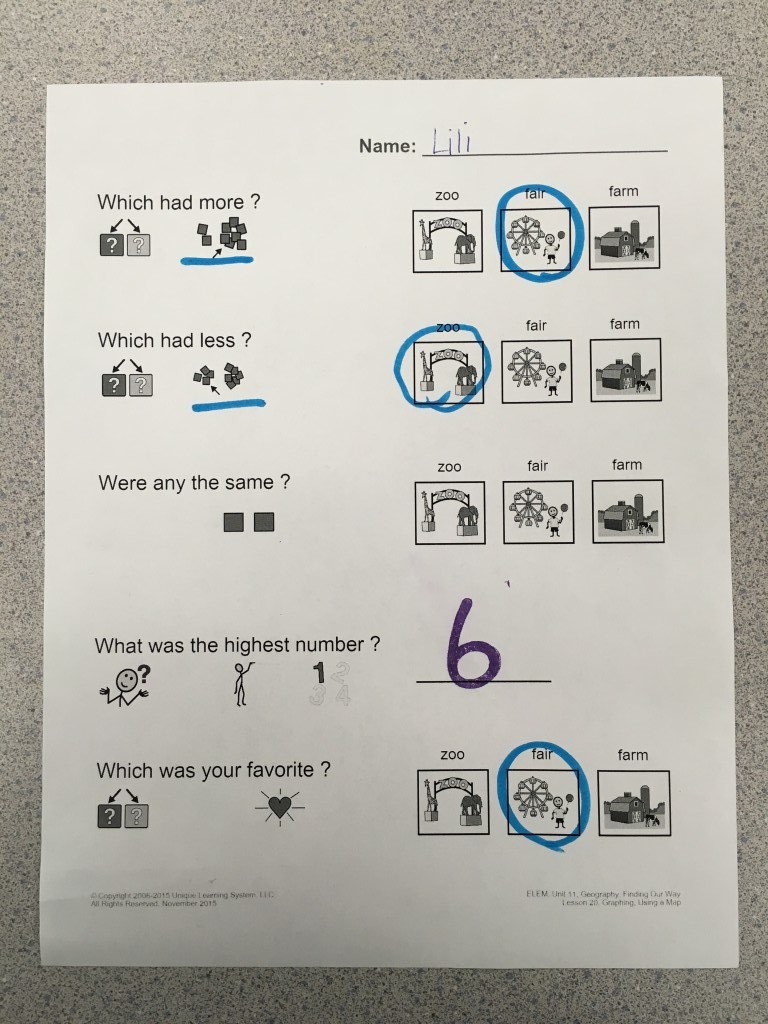
This month’s graphing data was about where we would like to use maps! We have read stories about characters who used a map at the zoo, at a fair and at a farm. So we asked “Where would you like to use a map?”, made a pictograph, sorted the answers, then put them on a graph and then colored the graph! We even analyzed the data to answer questions about the graph. (Most of our class would rather use a map at the fair, if you were wondering).